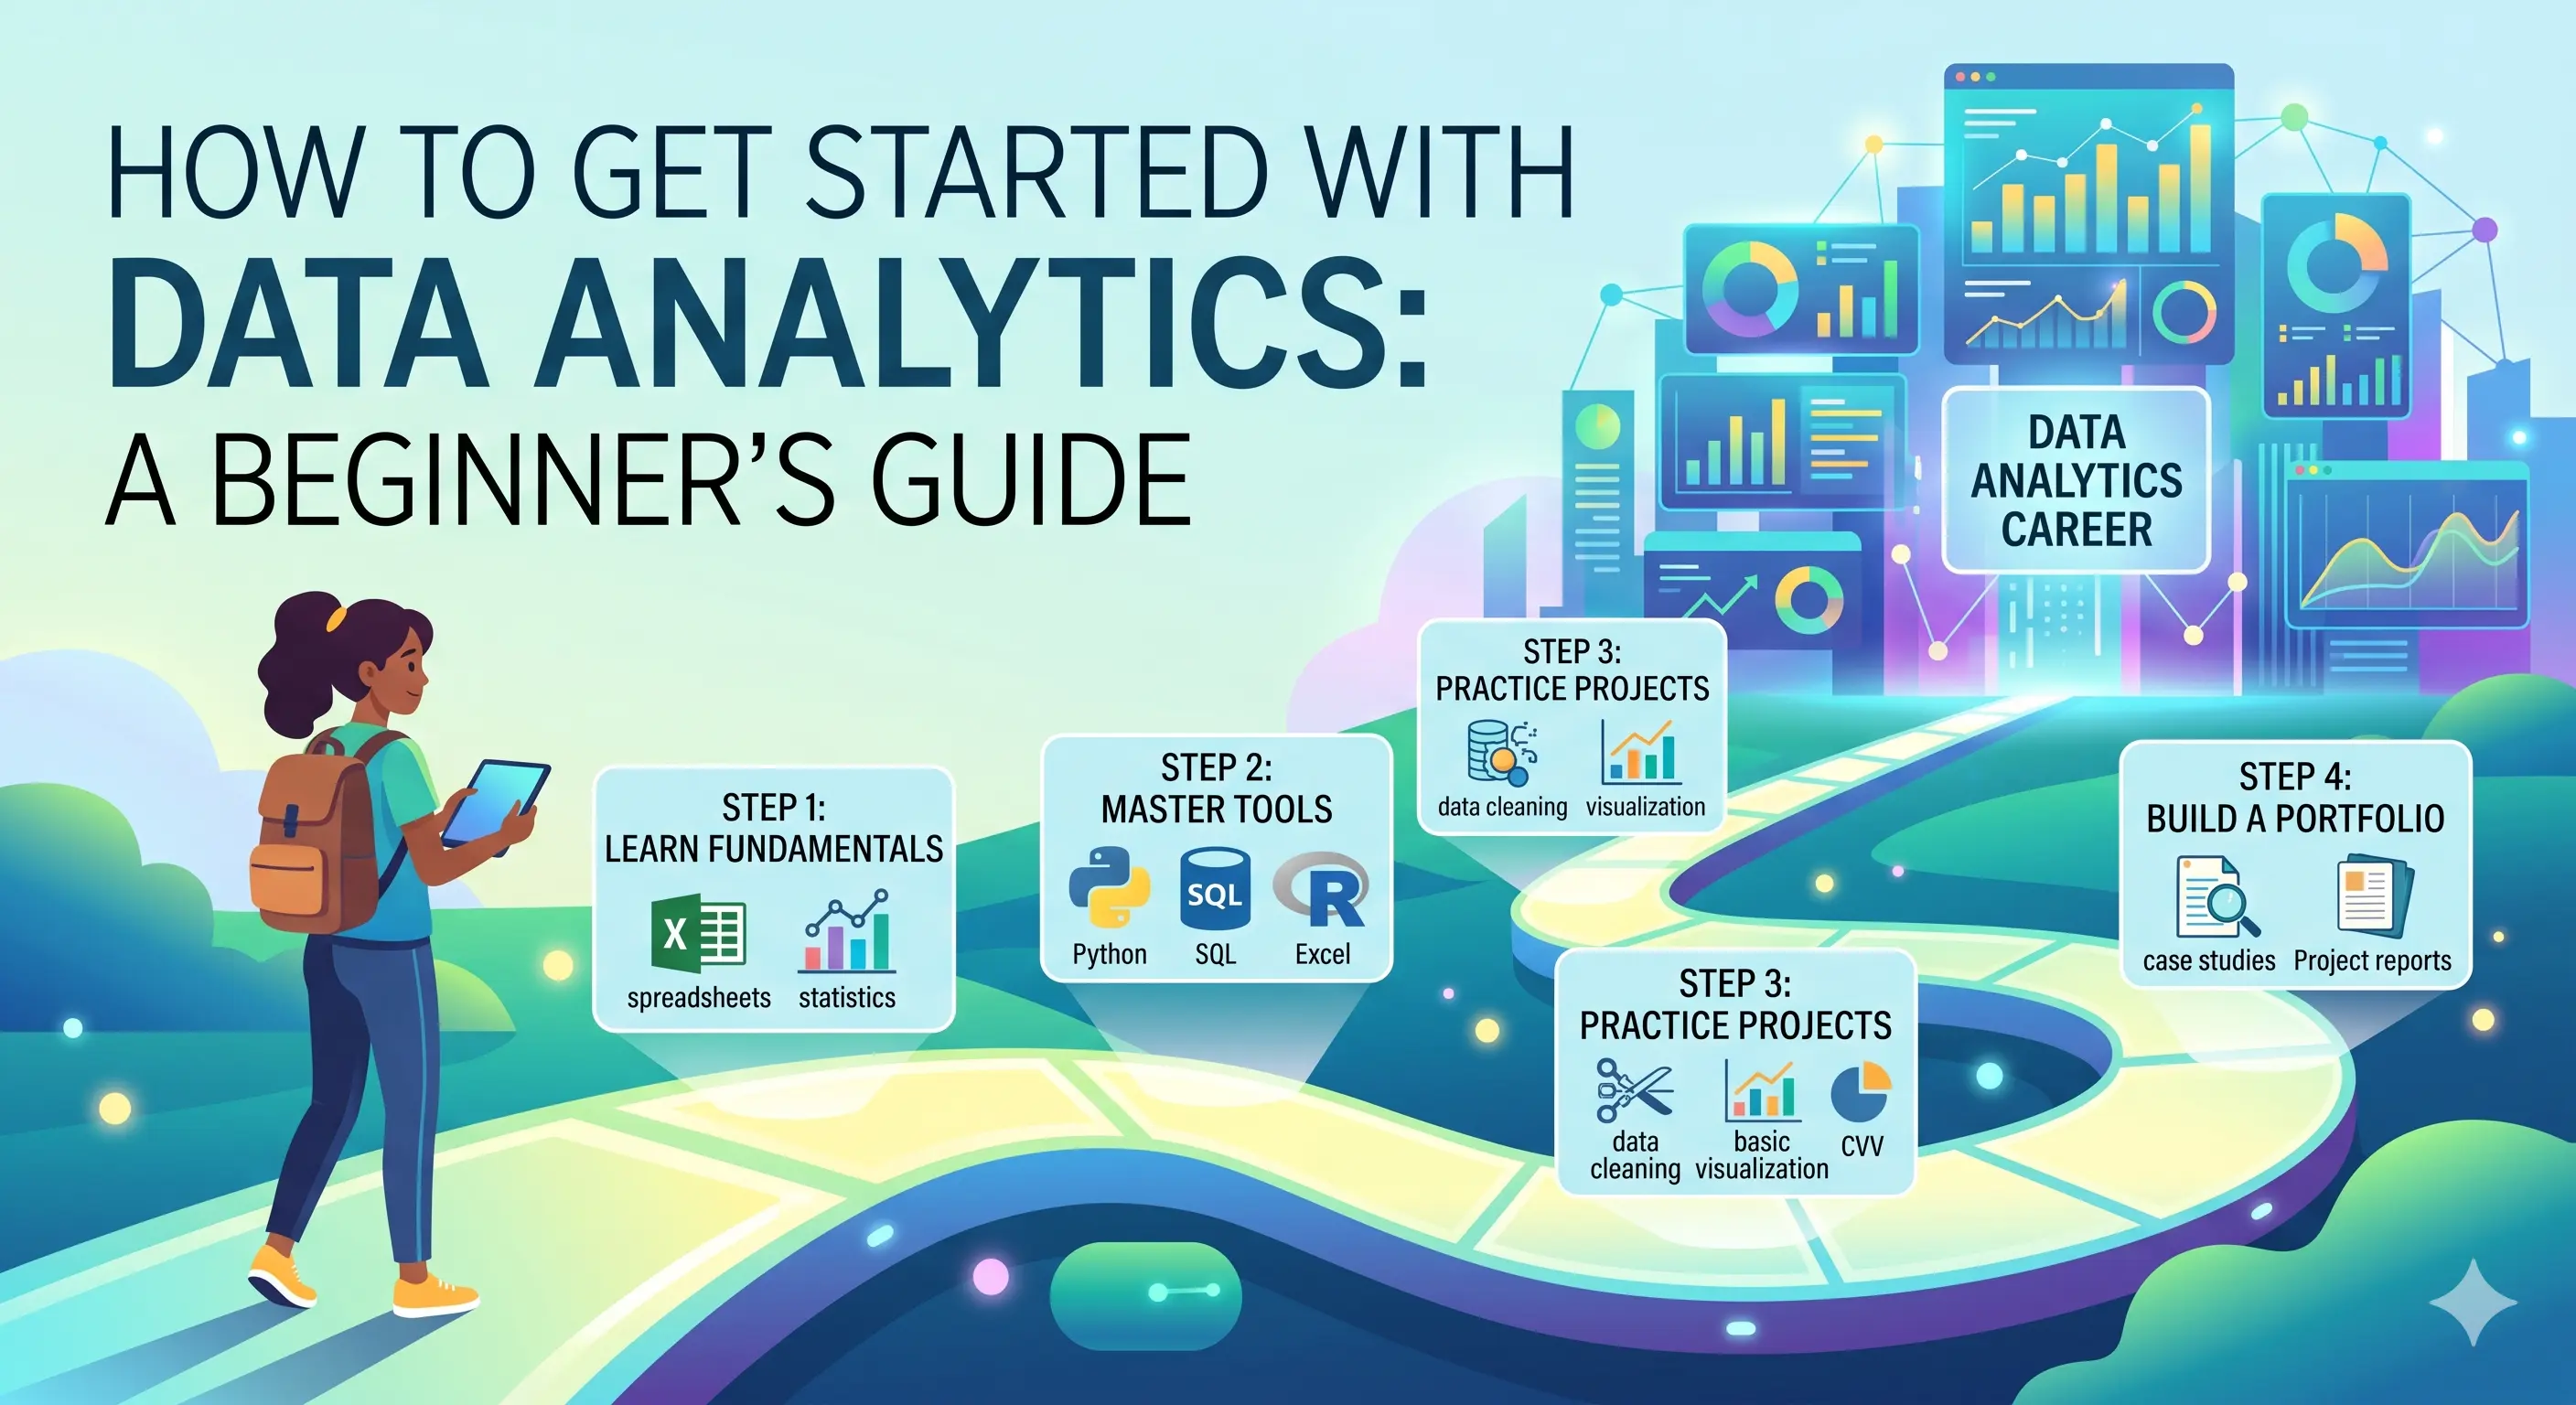
1. What Does a Data Analyst Actually Do?
Before diving into the how, it helps to understand the what. Data analytics answers questions like "What happened?" and "Why?" Analysts examine past and current data to identify trends and help teams make better choices. In practical terms, this means collecting raw data, cleaning it, running analysis, and presenting findings in a way that non-technical teams can act on.
Day-to-day tasks typically include:
- Collecting and cleaning datasets
- Identifying patterns and trends
- Building dashboards and visualisations
- Presenting insights to business stakeholders
2. Why Data Analytics Is Worth Pursuing Right Now
India is projected to create over 11 million jobs in data and analytics by 2026. That is not a number to ignore. Companies across e-commerce, healthcare, finance, and even education are actively hiring people who can make sense of data.
Fresh graduates in India can expect starting salaries of around ₹3–5 LPA, with experienced professionals earning ₹6–12 LPA and senior analysts commanding ₹12–18 LPA and above.
There is no single mandatory degree. Most hiring companies accept any bachelor's degree — engineering, commerce, mathematics, or sciences — as long as you can demonstrate proficiency with the right tools. That levels the playing field significantly.
3. The Core Skills You Need to Build
- Excel and Google Sheets: This is where most beginners should start. Learn pivot tables, VLOOKUP, basic formulas, and how to summarise data visually. It is unglamorous but foundational.
- SQL: SQL is how you pull data from databases — and nearly every analytics role requires it. Being able to write queries that answer real business questions is a skill you will use from day one.
- Python (Basics): You do not need to become a software developer. Focus on libraries like Pandas and NumPy for data manipulation, and Matplotlib or Seaborn for visualisation.
- Data Visualisation Tools: Power BI and Tableau are the industry standards. Being able to build clear, readable dashboards is a skill hiring managers actively look for.
- Statistics Fundamentals: Mean, median, standard deviation, correlation — these concepts form the backbone of analysis. You do not need to go deep into advanced statistics at the beginner level, but the basics are non-negotiable.
4. A Practical Roadmap to Follow
Month 1–2: Foundations
Start with Excel. Move to basic SQL. Watch free resources on YouTube or enrol in a structured beginner course.
Month 3–4: Tools and Projects
Learn Python basics. Pick one visualisation tool (Power BI is a strong starting choice for Indian job markets). Start working on small datasets — Kaggle has hundreds of beginner-friendly datasets you can practise on.
Month 5–6: Build Your Portfolio
Employers evaluate entry-level candidates based on whether they can work independently with data tools, catch errors before they compound, and explain what the numbers actually mean. A portfolio with 2–3 real projects is far more useful than a list of certifications alone.
Month 6 onwards: Get Real-World Experience
This is where internships become critical.
5. Why Internships Matter More Than Courses
You can watch a hundred hours of tutorials and still freeze when handed an actual business dataset. There is no substitute for hands-on experience — you will learn much more quickly and effectively by actually working on real data analysis projects.
An internship gives you:
- Real datasets with real messiness
- Deadlines and stakeholder expectations
- A portfolio entry that actually means something to recruiters
- A mentor or team to learn from
At Labmentix, our Data Analytics internship programme is designed for exactly this stage of your journey. You work on EDA (Exploratory Data Analysis) projects, build dashboards, and walk away with project work you can show in interviews — not just a certificate.